Examples
The following examples illustrate how to conduct XL-mHG tests and visualize the results using the Python API. For details on each method, including all optional parameters, see the API reference.
Conducting a test using the simple test function
This example demonstrates the use of the simple test function,
xlmhg_test(), for conducting an XL-mHG test.
Script:
import numpy as np
import xlmhg

v = np.uint8([1,0,1,1,0,1] + [0]*12 + [1,0])
X = 3
L = 10
stat, cutoff, pval = xlmhg.xlmhg_test(v, X=X, L=L)

print('Test statistic: %.3f' % stat)
print('Cutoff: %d' % cutoff)
print('P-value: %.3f' % pval)
Output:
Test statistic: 0.014
Cutoff: 6
P-value: 0.024
Conducting a test using the advanced test function
This example demonstrates the use of the advanced test function,
get_xlmhg_test_result(), for conducting an XL-mHG test.
Script:
import numpy as np
import xlmhg

v = np.uint8([1,0,1,1,0,1] + [0]*12 + [1,0])
X = 3
L = 10

N = v.size
indices = np.uint16(np.nonzero(v)[0])

result = xlmhg.get_xlmhg_test_result(N, indices, X=X, L=L)

print('Result:', str(result))
print('Test statistic: %.3f' % result.stat)
print('Cutoff: %d' % result.cutoff)
print('P-value: %.3f' % result.pval)
Output:
Result: <mHGResult object (N=20, K=5, X=3, L=10, pval=2.4e-02)>
Test statistic: 0.014
Cutoff: 6
P-value: 0.024
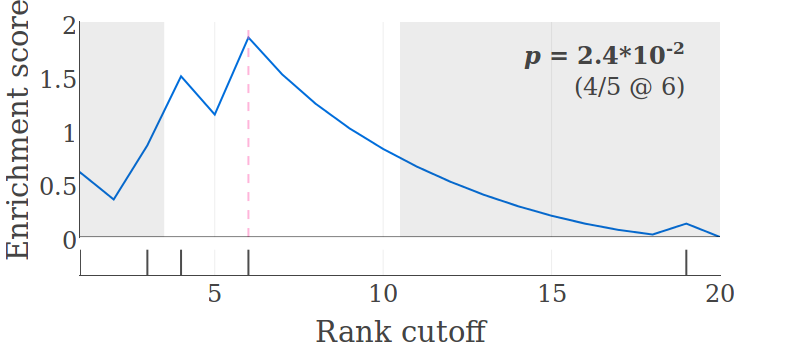
Visualizing a test result
This example demonstrates how to visualize an XL-mHG test result using the
get_result_figure() function and plotly.
Script:
import numpy as np
import xlmhg
from plotly.offline import plot

v = np.uint8([1,0,1,1,0,1] + [0]*12 + [1,0])
X = 3
L = 10

N = v.size
indices = np.uint16(np.nonzero(v)[0])

result = xlmhg.get_xlmhg_test_result(N, indices, X=X, L=L)

fig = xlmhg.get_result_figure(result)

plot(fig, filename='test_figure.html')
This produces an html file (test_figure.html) that contains an interactive
figure. Open the file in a browser (if it doesn’t open automatically) and click
on the camera symbol (the left-most symbol on top of the figure) to download
it as a PNG image. The image looks as follows: